Is your student data accurate and accessible?
Many schools are unable to access and analyse student data effectively because it is hosted on different platforms and presented in unrelated formats. Data is easily lost, not maintained, misinterpreted, or otherwise not utilised to its full potential. This problem obstructs access to the rich insights that facilitate rapid decision-making and effective interventions and, over the longer term, improve educational outcomes.
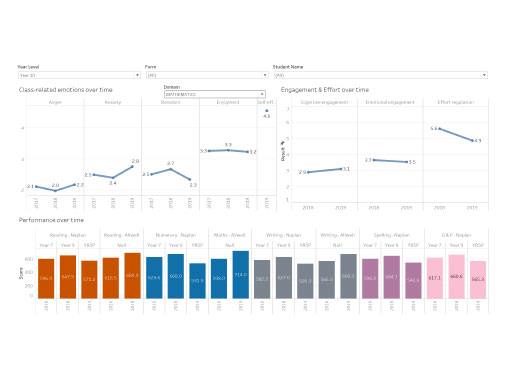
Our solution is to build customised individual student dashboards that consolidate the student’s data in one on-line site and presents it in consistent and accessible visual formats. The dashboard is maintained over the term of the student’s enrolment to provide a comprehensive record as well as to inform future actions.

How does it work?
Each dashboard consolidates the available student data (including for example, demographics, student attendance, Naplan scores, learning growth estimates, assessment task results, and progress reports).
Across several schools in Victoria, teachers are using our dashboards for setting goals with students and parents, in student interviews, and for lesson planning and decision-making.
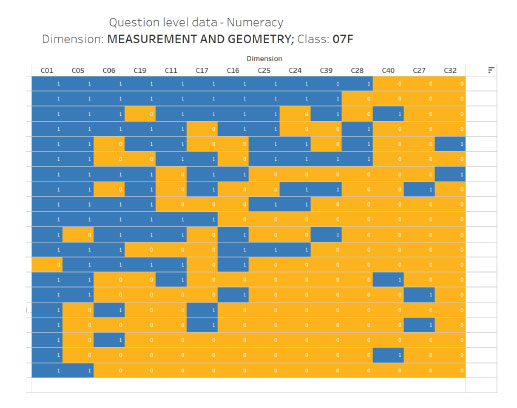
A feature of the student dashboards is their user-friendly graphics that communicate information quickly, clearly, and effectively.

The student data dashboard developed by Analytics for Schools has been a “game-changer” for my staff and a powerful enabler of evidence-based practice. This user-friendly, one-stop platform, provides a snapshot of each learner that not only includes performance and learning growth data, but also critical engagement and well-being measures. Invaluable information that can be used by teachers, students, and parents.
Principal Dandenong High School
Analytics for Schools provides comprehensive support to school leaders to support teachers in analysing sets of data – attendance, NAPLAN, PAT GAT, chronicle entries and assessments – all in one central location. This has been the best investment in building teacher capability to improve student outcomes!
Principal Bentleigh Secondary College
Frequently Asked Questions
What types of student dashboards are available for my school?
School and educational data has a hierarchical structure. Students (at the base of the hierarchy) are nested within classes or teachers on the tier above. Teachers, in turn, are nested within higher-level faculties, houses, departments. We usually start by designing student-level dashboards before progressing to class-level dashboards, then finally dashboards that gather information at a faculty lor school level. These details can be tailored to the meet the needs of individual schools.
What kind of information goes into the student dashboards?
We suggest that all learning-related data be included, such as learning growth estimates, assessment task results, test scores, attendance, progress reports, and grades. We can also include additional data that you may want to make available to your teachers (e.g., well-being survey results).
How often are the dashboards updated?
Student Dashboards are updated on a fornightly basis, unless otherwise instructed. We could update it more frequently if required by the school and the data is available.
How secure is my data?
All our services are tools are delivered in compliance with the Australian Privacy Principles, and all details concerning the collection, use, and security of your data is clearly presented to you in our service agreement and privacy policy.
